Insights
An insight is a single finding: a misconfiguration, a security gap, an availability concern, or a compliance issue that one of your assessments surfaced. The Insights page is where you triage them.
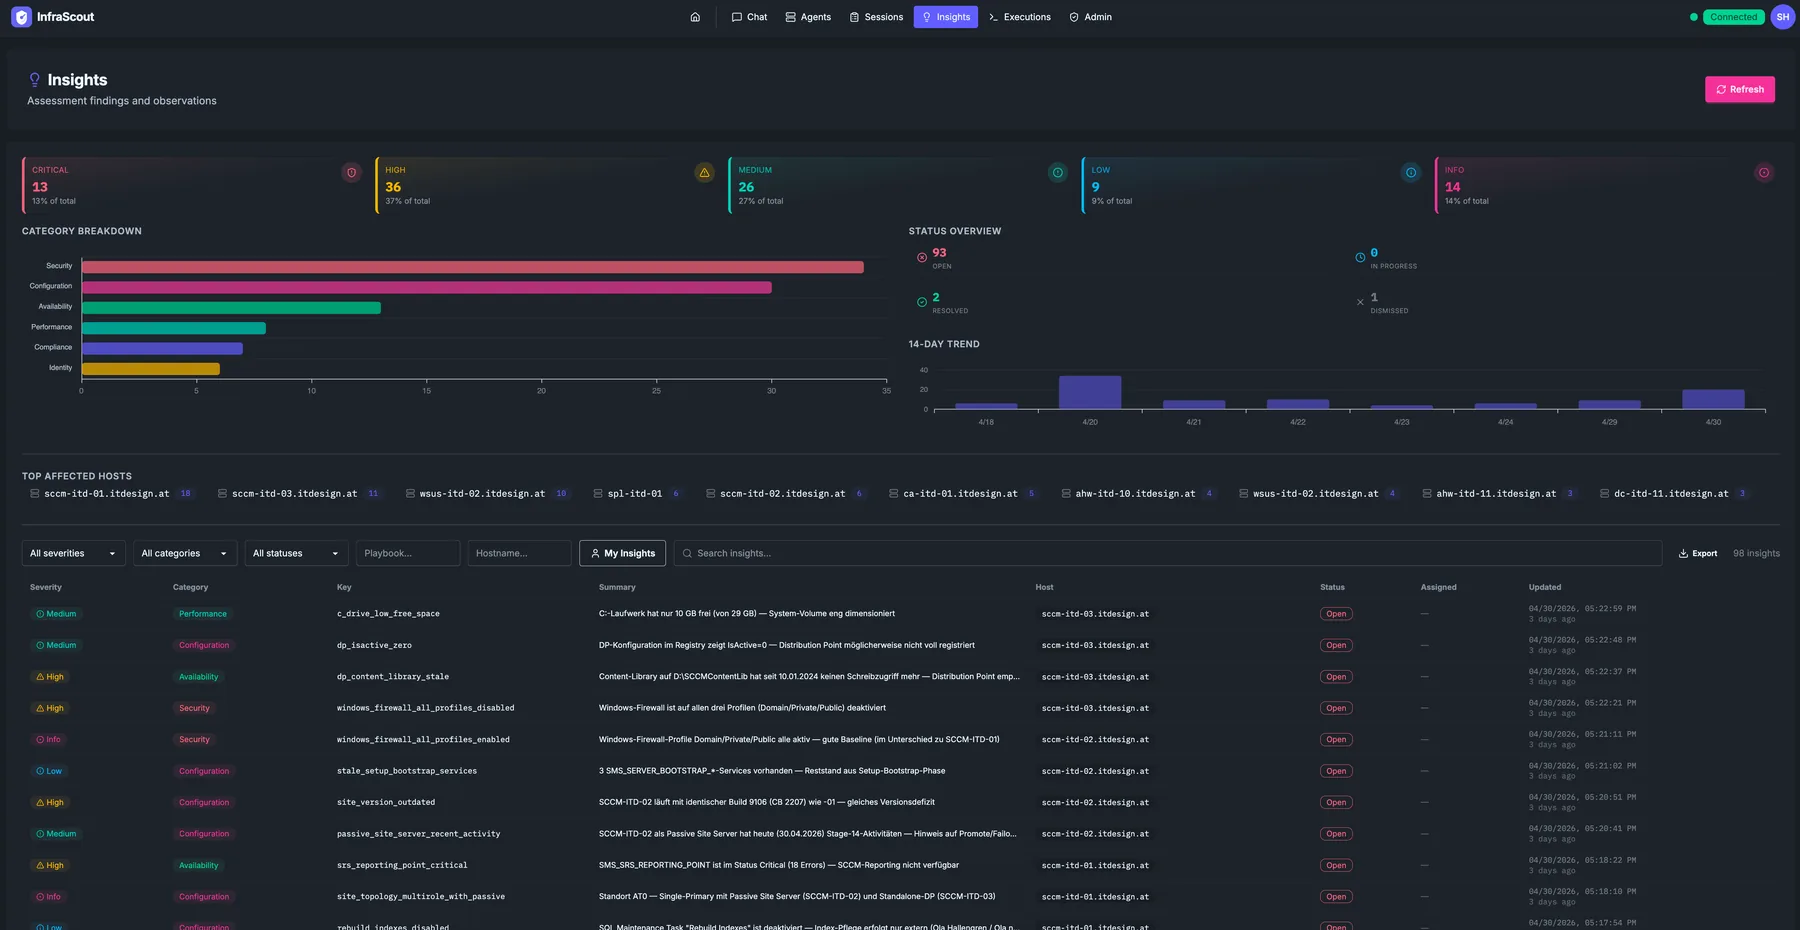
Top strip — counters by severity
The strip across the top is the at-a-glance posture of your environment. Each card shows the open count for one severity level — Critical, High, Medium, Low, Info — plus the share of total findings it represents. Click any card to filter the table below to that severity.
Category breakdown
The horizontal bars below the counters show the open insight count per category — Security, Configuration, Performance, Identity, Availability, Networking, Compliance, Licensing. The categories come from the playbook that produced the finding and stay stable across runs, so the chart is a useful signal for "where is our biggest backlog".
Status overview and 14-day trend
To the right of the category bars sit two complementary panels:
- Status overview — a donut showing how findings split between Open, In Progress, and Resolved. The numbers in the legend are absolute counts.
- 14-day trend — opened vs. resolved per day over the last 14 days. A widening gap (opened above resolved) tells you the queue is growing faster than you can clear it.
Top affected hosts
Below the charts, Top Affected Hosts lists the hostnames with the most open findings, ranked by count. The chip to the right of each hostname is the count itself. Click a host to filter the table to that host — useful when you are deciding which machine to fix first.
Findings table
The bottom of the page is a filterable, sortable table of every insight visible to your identity. The filter row supports:
- Severity dropdown (multi-select).
- Category dropdown.
- Status dropdown.
- Playbook dropdown — narrow to findings produced by a specific playbook.
- Hostname text filter.
- My Insights toggle — flip to Assigned to me in one click.
- Search — full-text against title and key.
Each row shows severity chip, category chip, the key (the stable identifier the playbook uses, like windows_firewall_all_profiles_disabled), a one-line summary, the affected host, the status, the assignee, and the last-updated timestamp. The Export button on the right exports the current filter set to CSV. 365 insights in the corner is the total count after filters apply.
Click any row to open the insight detail view with full evidence, remediation guidance, and the chat thread that produced the finding.
Visibility
Insights inherit visibility from the session that produced them. Every row you see is one your identity is allowed to read. The My Insights toggle is the most reliable way to scope to your own assigned work — in personal triage flows we recommend pinning that toggle on.