Executions (Audit)
The Executions audit tab is the tenant-wide companion to the user-area My Executions page. Every remote command issued through InfraScout — from Chat, from playbooks, from inventory sweeps — is captured here regardless of which user triggered it. It is the canonical record for "what did this tenant run, and when".
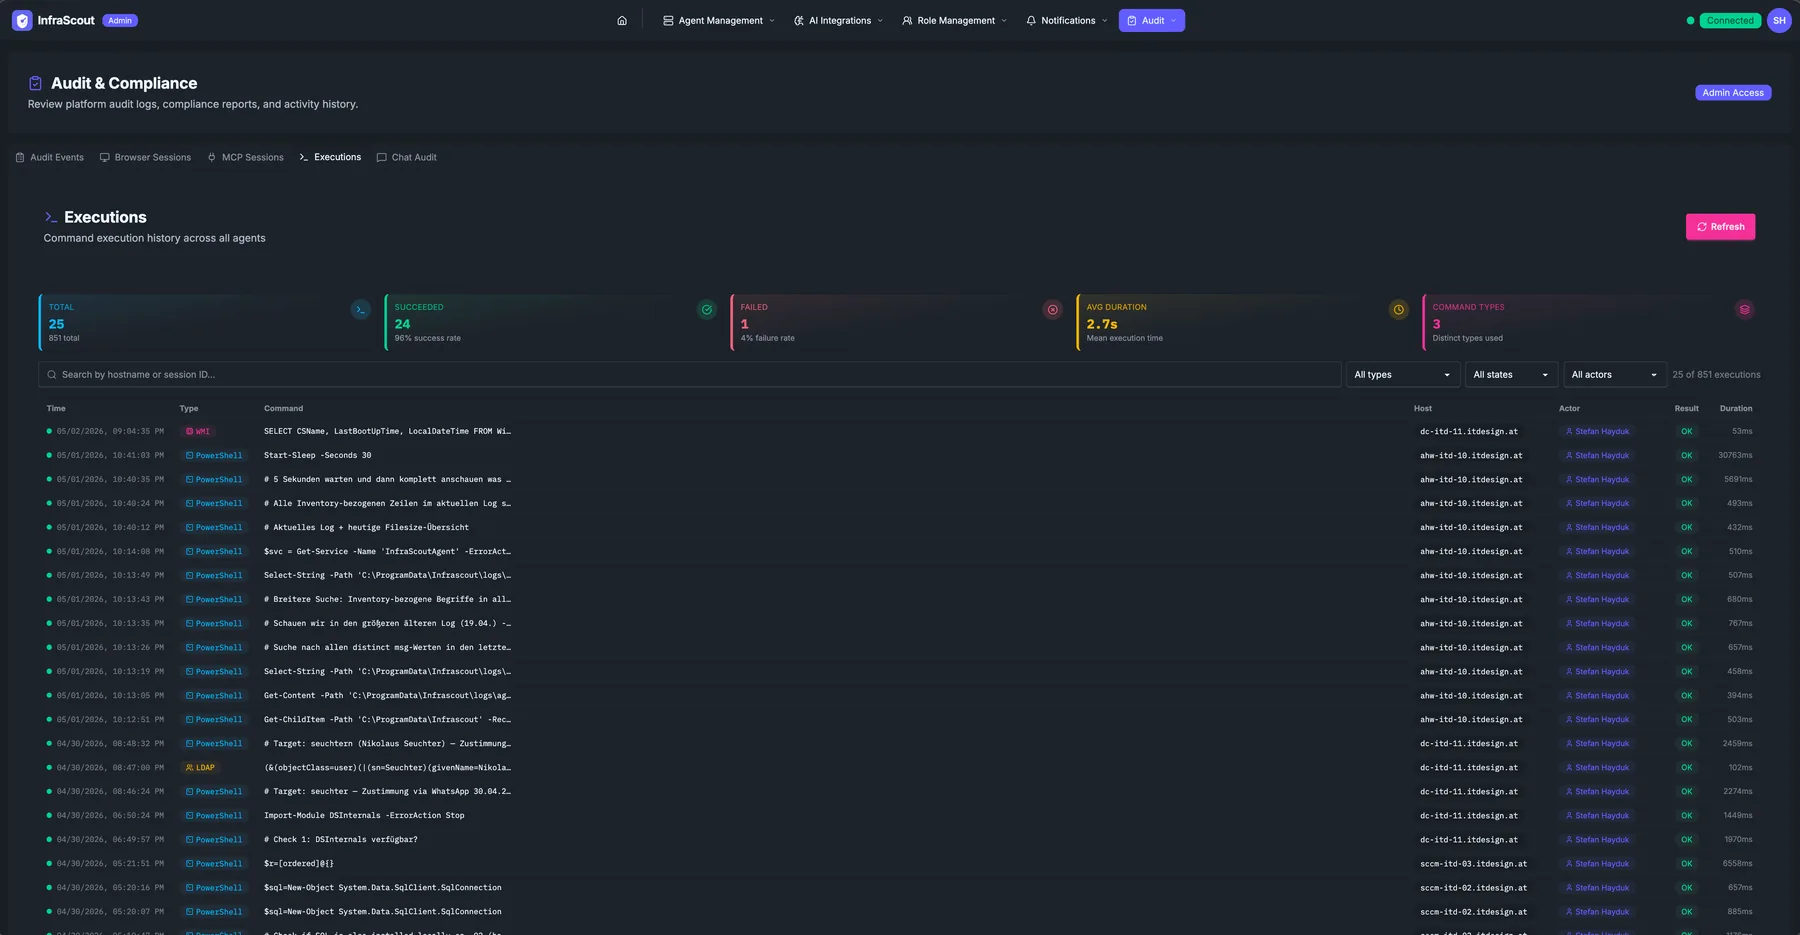
KPI strip
The strip across the top mirrors the user-area page but counts across every user:
- Total — every execution captured in the current view.
- Completed — finished successfully.
- Failed — finished with an error or non-zero exit.
- Avg duration — mean wall-clock time across the visible rows.
- Latest — relative timestamp of the most recent execution.
The KPIs respect the active filter set; narrowing by type or status updates the math live.
Filters
The filter row above the table:
- Category — the kind of work rather than the specific tool: an agent command run on one of your hosts, a cloud query against a connected Microsoft tenant, a call to an external MCP server, a call to a server hosted on an agent, a native read of InfraScout's own records, or orchestration overhead. Start here when the question is "what kind of activity happened", and drop to the Type filter when you want one specific tool.
- Type —
agent_exec_shell,agent_exec_powershell,agent_exec_wmi,agent_query_eventlog,agent_read_log_file, etc. - Status — All, Completed, Failed.
- Source — Chat, Playbook, Inventory, Manual.
- Search — full-text against the command line, the user, or the host.
The total in the corner (Showing 1–N of M) reflects the filter set. The Category filter opens on the categories that represent real action, so orchestration overhead does not pad the view you audit against.
Table
Each row is one execution:
- Time — absolute and relative.
- Type — chip for the tool that ran.
- Tool / Command — the exact tool that ran (for example
mscloud_identity_list_users) on the primary line, with the request summary beneath it. Long lines truncate; click to expand. - Host — the agent hostname the command ran on.
- Source — chip linking back to the chat, session, or policy that triggered the run.
- Result — Completed / Failed chip.
- Duration — wall-clock time.
Agent commands — shell, PowerShell, WMI, LDAP, event log, and log file — record their tool name on new executions too; rows recorded before tool names were captured show the command summary alone. A Log File chip marks a run of agent_read_log_file, the cross-platform log reader. An MCP Tool chip marks a call the AI made to an MCP server hosted on one of your agents — those route through the agent like any other command, so they are recorded here as well as in the MCP session log. The same tool-first layout appears in the execution list on a session's detail view.
Each row also names the actor behind the run. A user actor is a person driving the command from Chat, a workflow actor is an agentic workflow running under its service account, and a system actor is the platform itself — scheduled inventory and update work that no person triggered. Read the actor chip when you need to separate human activity from automation.
Click a row to open the execution detail panel: full stdout, full stderr, exit code, the user who triggered the run, the chat or session context, and the playbook step (when applicable).
Retention
The audit log retains every execution for the tenant retention window — typically 365 days, configured at deployment time. Older rows are pruned automatically. If you need a longer-term archive, export the relevant period (the export button in the page header produces CSV).
Common workflows
The most common queries: "show every powershell run by user X this week" (filter Source = Chat or Playbook, Search = username, narrow the date), "every failed inventory sweep on Monday" (Type = inventory tool, Status = Failed, date range = single day), and "the exact commands a third-party assessor ran" (filter by their user, export to CSV, attach to the engagement report).