Dashboard
The dashboard is the first screen you see after signing in. It is built as a personal triage view: critical findings that need attention, sessions currently running, your own activity, and the overall health of your agent fleet — all on one page.
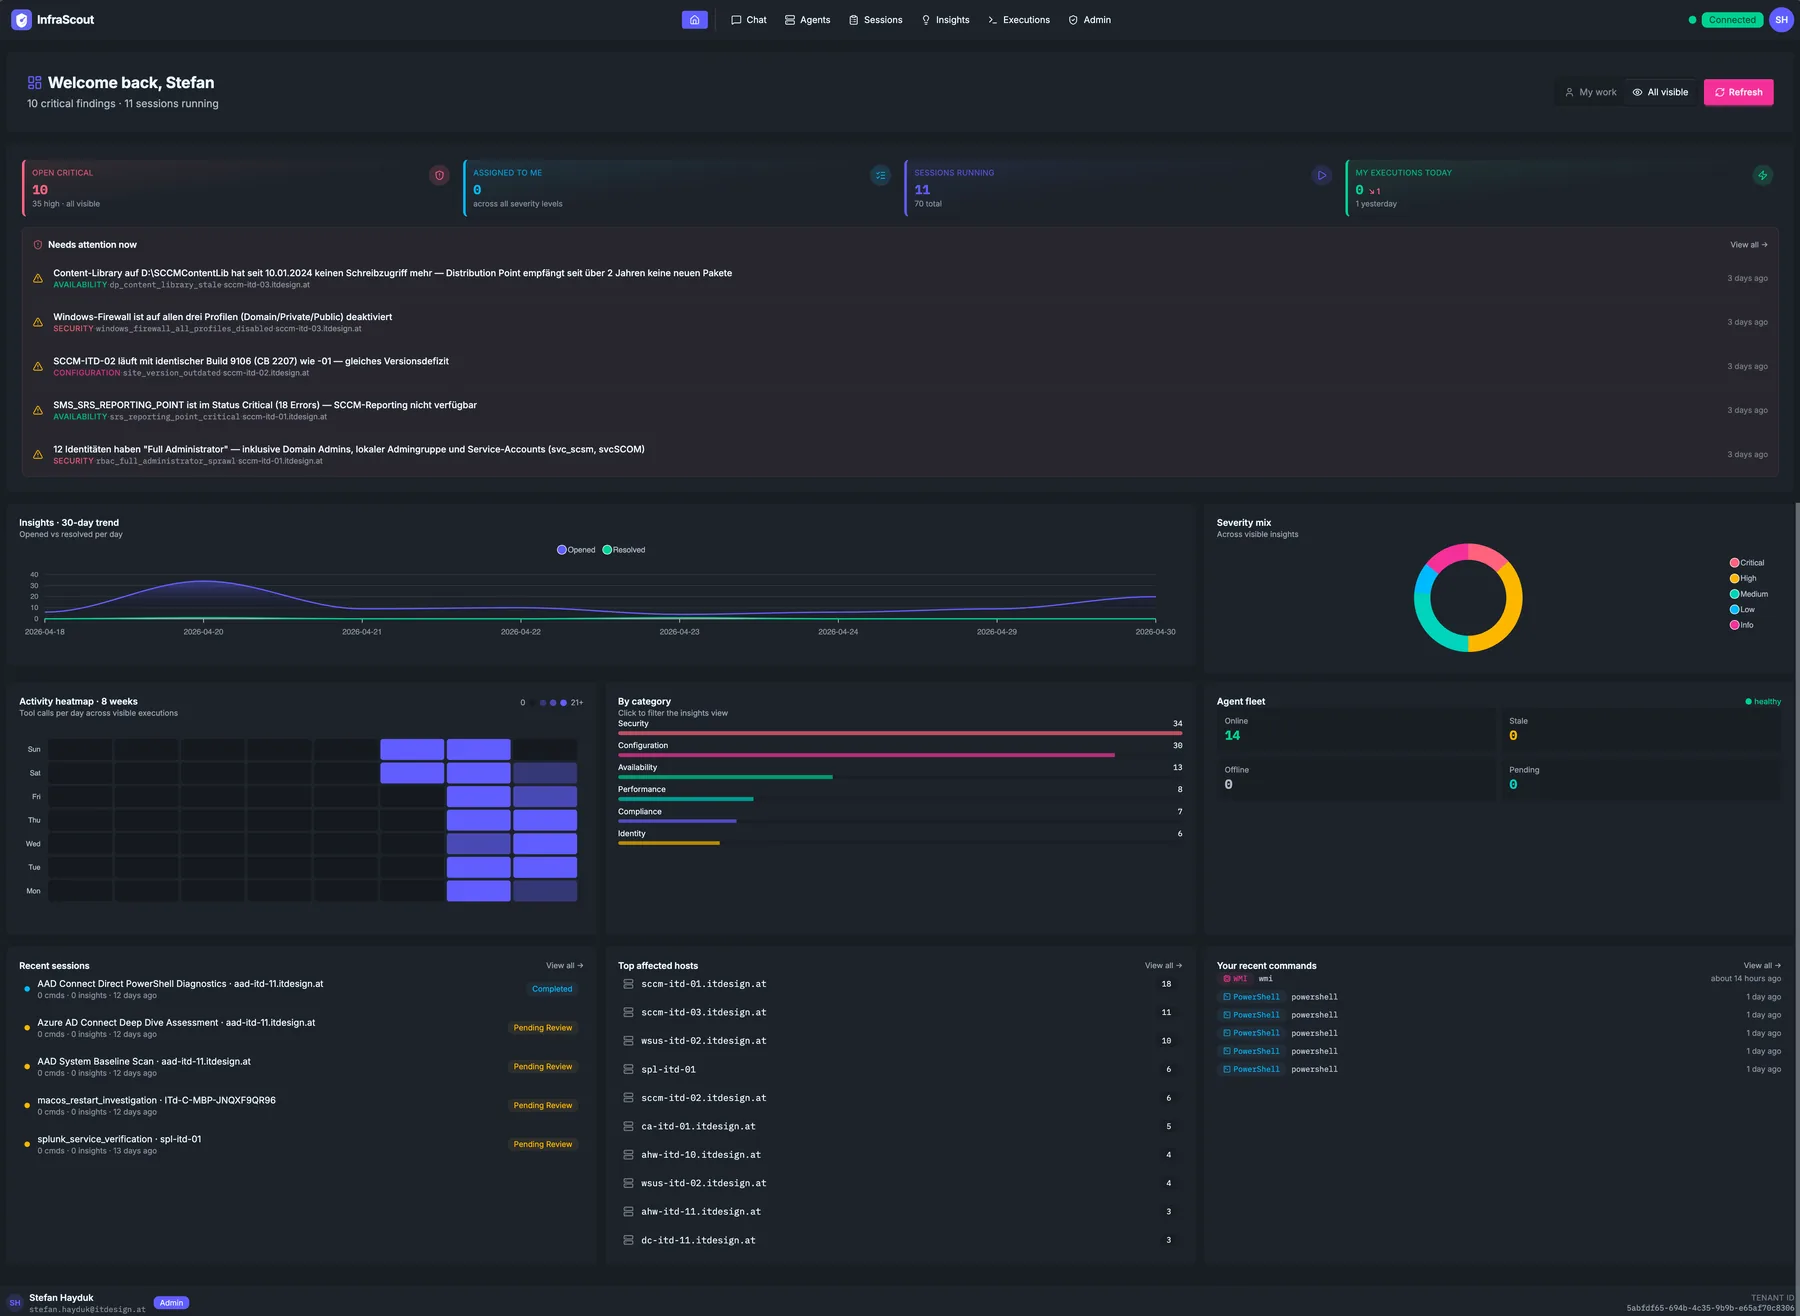
Hero header
The hero greets you by name and shows a one-line summary line — for example "10 critical findings · 11 sessions running" or, when the queue is empty, "All clear · no running sessions". The summary is computed live from the same numbers as the KPI strip below.
Two controls sit on the right of the hero:
- My work / All visible scope toggle. My work limits the entire dashboard to items assigned to you; All visible shows everything your identity is allowed to see. The choice persists in browser storage and applies on every revisit.
- Refresh button. The dashboard refreshes itself via SSE whenever something changes — manual refresh is a fallback you use when you want to force a full reload.
Zone 1 — Triage
The top zone answers "what should I look at right now". Four KPI cards on the left of the zone cover the most actionable counts:
- Open Critical — total open critical findings in the current scope, with the count of high-severity items as context.
- Assigned to me — open insights where your Entra identity is the assignee, across every severity.
- Sessions running — currently active assessment sessions, with the all-time total as a denominator.
- My executions today — commands you (the signed-in user) ran today; the delta arrow compares against yesterday.
Below the KPIs, Needs attention now lists the most recent critical and high-severity insights. Each row shows the insight title, its category, its key (the stable identifier the playbook used), the affected hostname, and a relative timestamp. Click any row to open the insight detail; the View all link top-right takes you to a pre-filtered view of /insights?severity=critical,high&status=open.
When the list is empty you see a "All clear" message instead — useful confirmation that there is genuinely nothing in the queue, rather than a missing-data UI bug.
Zone 2 — Status
The middle zone gives you the at-a-glance posture of your environment without making you click into individual lists. It is a five-panel grid:
- 30-day trend (burndown) — opened vs. resolved insights per day over the last 30 days. Spans two columns. A widening gap (opened above resolved) signals that findings accumulate faster than you close them.
- Severity mix (donut) — distribution of all in-scope insights by severity (critical / high / medium / low / info).
- Activity heatmap — a calendar-style heatmap showing the volume of insight or execution activity per day. Useful for spotting cadence — quiet weekends, busy month-ends.
- Category bars — count of insights per category (security, identity, networking, compliance, performance, configuration, availability, licensing). Click a bar to jump to
/insights?category=<that category>. - Agent fleet — coarse breakdown of agents into online, stale, offline, and pending. The detailed status with individual hostnames lives on the Agents page.
Zone 3 — Activity
The bottom zone surfaces the most recent items across three streams, side by side:
- Recent sessions — newest assessment sessions, regardless of state (running, pending review, completed, etc.). Each row links to the session detail.
- Top affected hosts — hostnames with the most open insights. Useful when you're prioritizing which host to remediate first.
- Recent executions — the most recent commands executed during sessions. Each row links into the execution detail.
How it stays fresh
Every dashboard panel subscribes to an SSE channel — agent updates, session updates, execution updates, insight updates. When the backend publishes a relevant event, the dashboard schedules a debounced refresh (300ms) so a flurry of events triggers exactly one reload, not one per event. The result: numbers and lists stay accurate without you ever needing to click Refresh.
Common workflows
- Morning triage. Open the dashboard, glance at the Open Critical count, scan Needs attention now. If something is new, click into the insight; otherwise close the tab.
- Plan remediation work. Use Top affected hosts to pick the host with the most findings, then click through to its agent detail modal and start a session.
- Spot trends. The 30-day burndown reveals whether you're keeping up with new findings. If opened consistently outpaces resolved, that's a staffing or playbook signal.
- Personal vs. team view. Toggle My work before a 1:1 with your manager to scope everything down to your queue; toggle back to All visible for situational awareness.