Executions
The Executions page is your personal audit log. Every remote command that ran on your behalf — directly through Chat, indirectly through a playbook, or as part of an inventory sweep — shows up here in a single timeline. Use it when you need to remember exactly what you ran, copy a previous command, or share a result with a colleague.
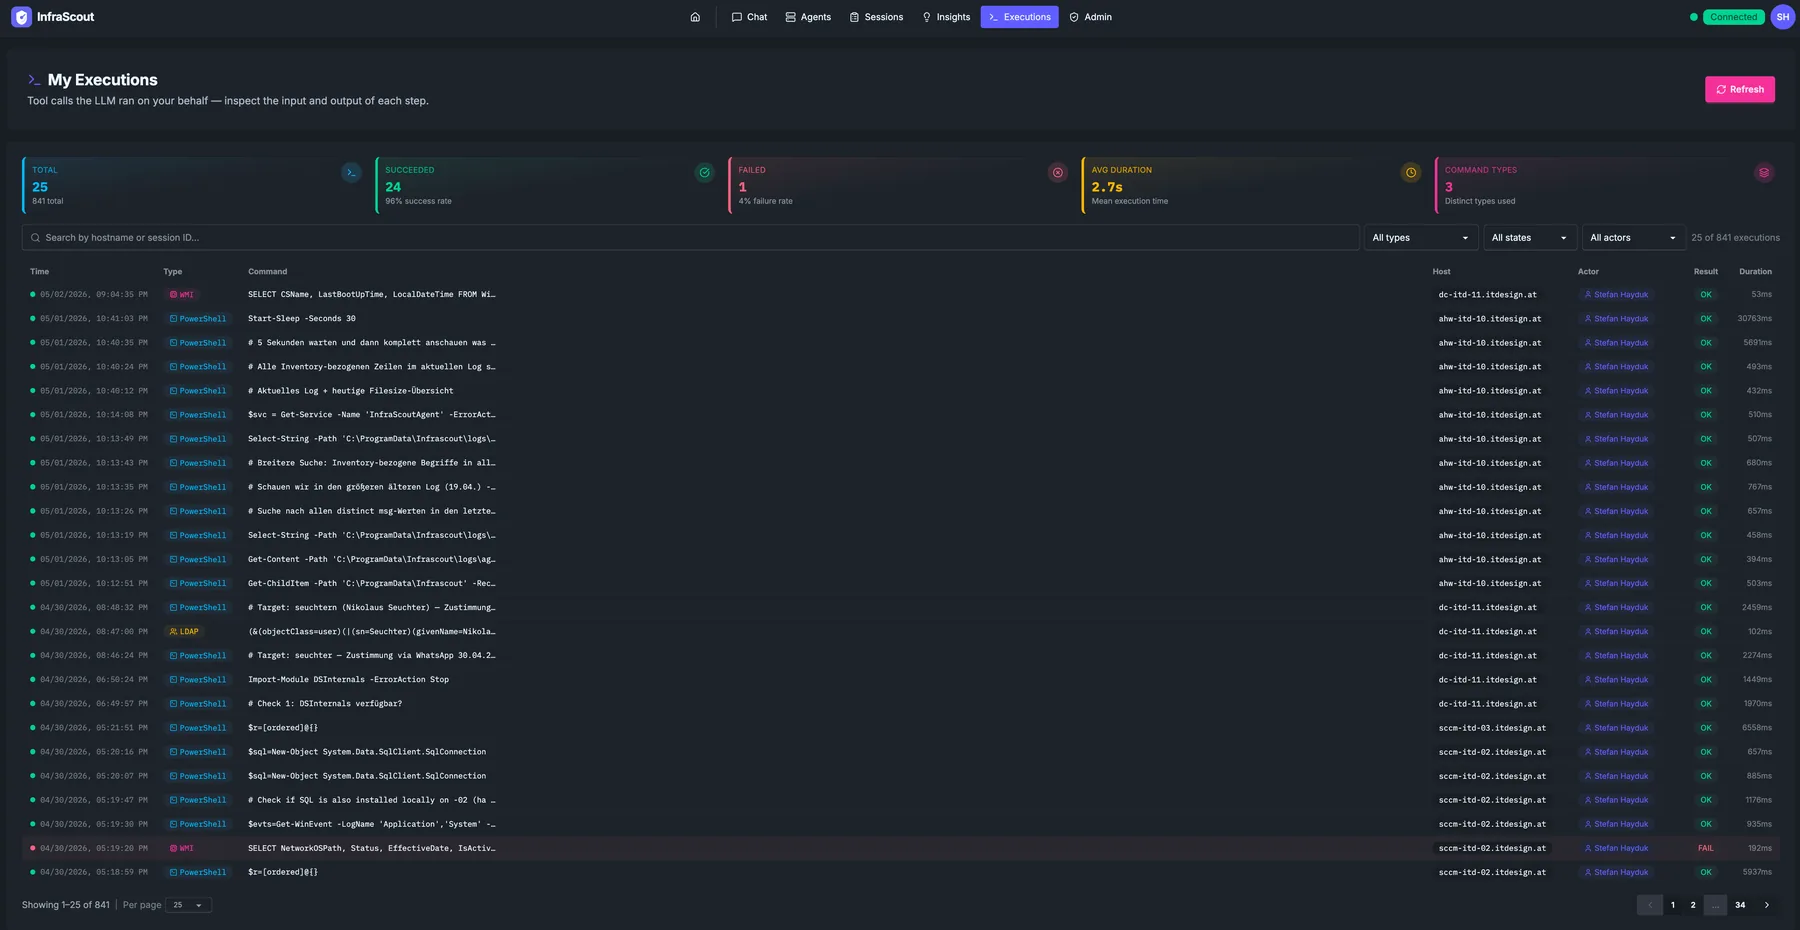
KPI strip
The top strip summarizes the table below at a glance:
- Total — every execution captured in the current view.
- Completed — finished successfully.
- Failed — finished with an error or non-zero exit.
- Avg duration — mean wall-clock time across the visible executions.
- Latest — relative timestamp of the most recent execution.
The strip respects the active filter. Filter to Failed and the count flips to "failures only", along with average duration computed across just those rows.
Filters
Three filters live above the table:
- Type —
agent_exec_shell,agent_exec_powershell,agent_exec_wmi,agent_query_eventlog,agent_read_log_file, and so on. Use this to narrow to one kind of remote call. - Status — All, Completed, Failed.
- Source — Chat, Playbook, Inventory, Manual.
- Search — full-text against the command line.
The total in the corner (Showing 1–20 of 64) reflects the filter set.
Table
Each row is one execution:
- Time — absolute timestamp and relative ago.
- Type — the tool that ran, as a chip.
- Tool / Command — the exact tool that ran (for example
agent_exec_powershell) on the primary line, with the request summary beneath it. Long lines truncate; click to expand. - Host — the agent hostname the command ran on.
- Source — chip linking back to the chat or session that triggered the run.
- Result — Completed / Failed chip.
- Duration — wall-clock time.
Agent commands — shell, PowerShell, WMI, LDAP, event log, and log file — record their tool name on new runs too; rows recorded before tool names were captured show the command summary alone. A Log File chip marks a run of agent_read_log_file, the cross-platform log reader.
Click a row to open the execution detail panel, which shows the full stdout, stderr, and exit code, plus the chat or session context. The most recent row is highlighted in pink to draw your eye to the latest run.
Scope
This is your execution log — only commands that ran on your behalf appear here. For the tenant-wide audit trail that captures every execution from every user, see Audit & Compliance — Executions.
Common workflows
The Executions page is useful for three things in particular: rerunning a command you ran yesterday (open the row, copy the command line, paste it back into Chat), debugging why an assessment failed (filter to Failed, scan the stderr in the detail panel), and confirming exactly what you ran during an engagement (filter by date and export).