A Focused Dashboard and a Cleaner Split for Executions
April 27, 2026 · InfraScout Team
A few days after the introductory post, we're shipping the first big workspace update: a redesigned dashboard built around three zones, a scope toggle that lets you collapse the view down to your own work, and a cleaner split between the personal Executions view and the admin audit trail. The goal is the same across all three changes — less noise on the everyday screen, and a dedicated surface for the people who need to see everything.
Three zones, one workspace
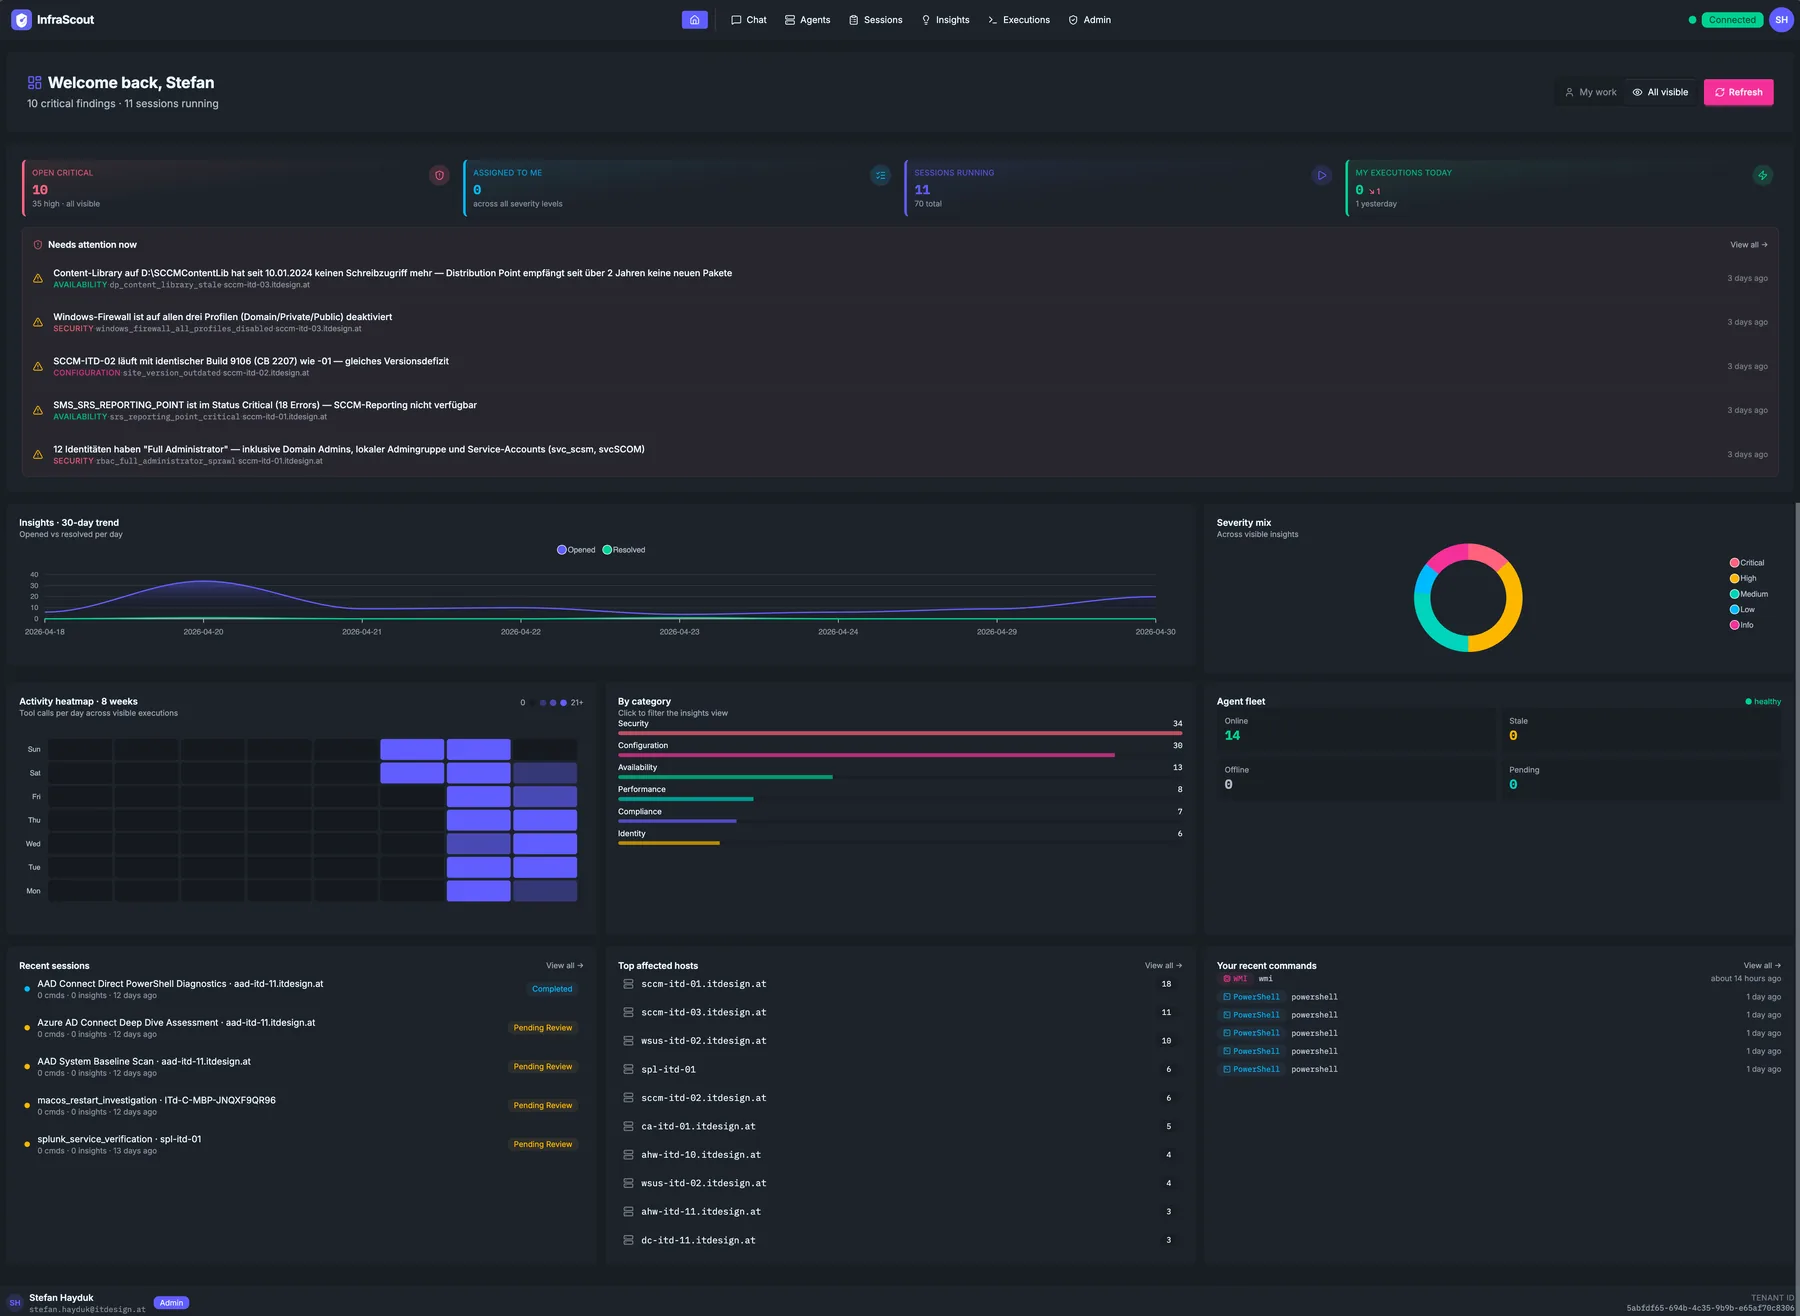
The new dashboard organizes everything around how you actually move through a workday. The first zone is triage — open critical and high-severity insights, the items currently assigned to you, and the executions you've run today and yesterday. This is what you check first when you sit down. The second zone is status — a burndown of insights resolved over time, severity and category breakdowns, and the agent fleet at a glance. This is where you confirm things are trending the right way. The third zone is activity — a 12-week heatmap of execution density, recent sessions, top hosts, and the latest executions — so you can see what the platform has been doing and jump straight into any session that looks interesting.
Each card loads independently, so a slow section never blocks the rest of the page from rendering. Live updates reflect within a moment of any session or insight changing, which means the dashboard stays accurate without you reaching for refresh.
My work or all visible — your choice
At the top of the dashboard you'll find a My work / All visible toggle. It changes what every card on the page counts and lists.
In My work, the dashboard collapses down to assessments where you're the responsible actor — your assigned insights, your sessions, your executions. This is the default, because most days you only care about the work that's yours. In All visible, the dashboard zooms back out to everything you have permission to see, which is what an operations lead or a security reviewer wants when they need the whole picture.
Your choice is remembered between visits. Switch once, and the next time you load the dashboard it picks up where you left off.
Executions, split in two
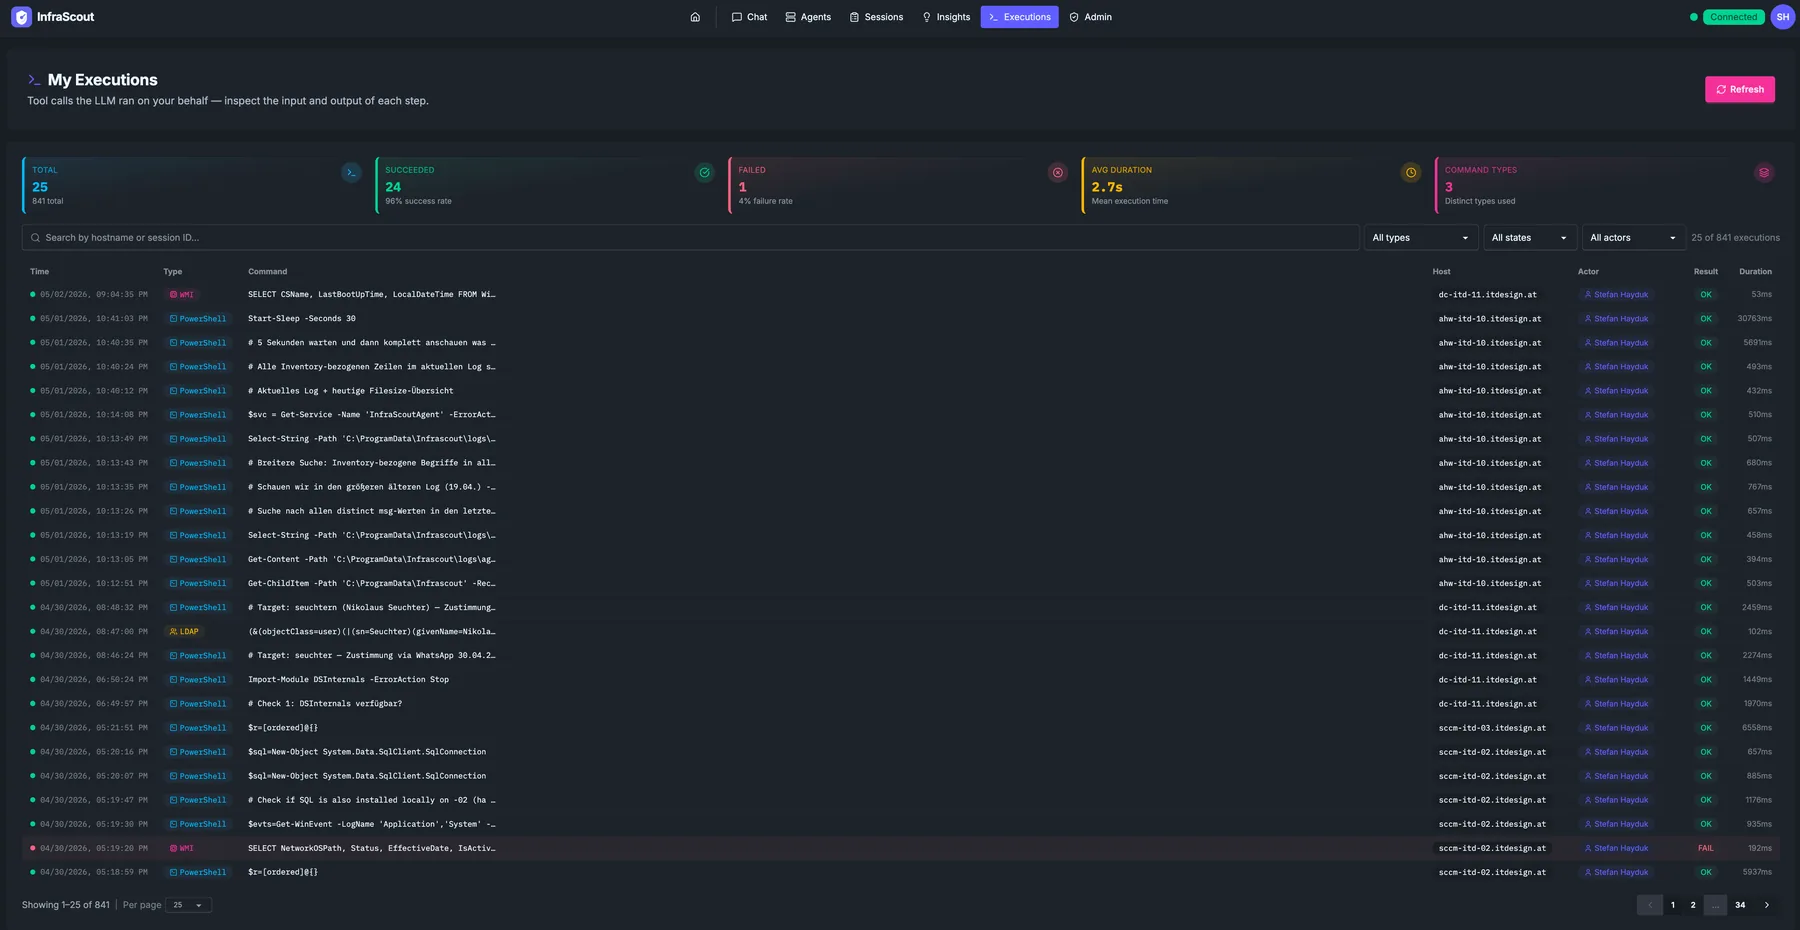
Executions used to be a single list everyone shared. That made sense early on, but it conflated two very different jobs: an individual operator asking "what have I run lately?" and a compliance officer asking "what has happened across the platform?" We've split those into two views.
The personal Executions view stays where you'd expect it in the main navigation. It shows only the executions you ran — your tool calls, your sessions, your audit trail. You can use it to inspect how the AI client decided in your own sessions and what each tool call returned, without seeing anyone else's actions.
The platform-wide list now lives under Admin → Audit and Compliance → Executions. It's restricted to administrators and shows every execution across the tenant — every actor, every session, every tool call. This is the surface security teams and auditors need when they're reviewing activity for compliance or investigating an incident.
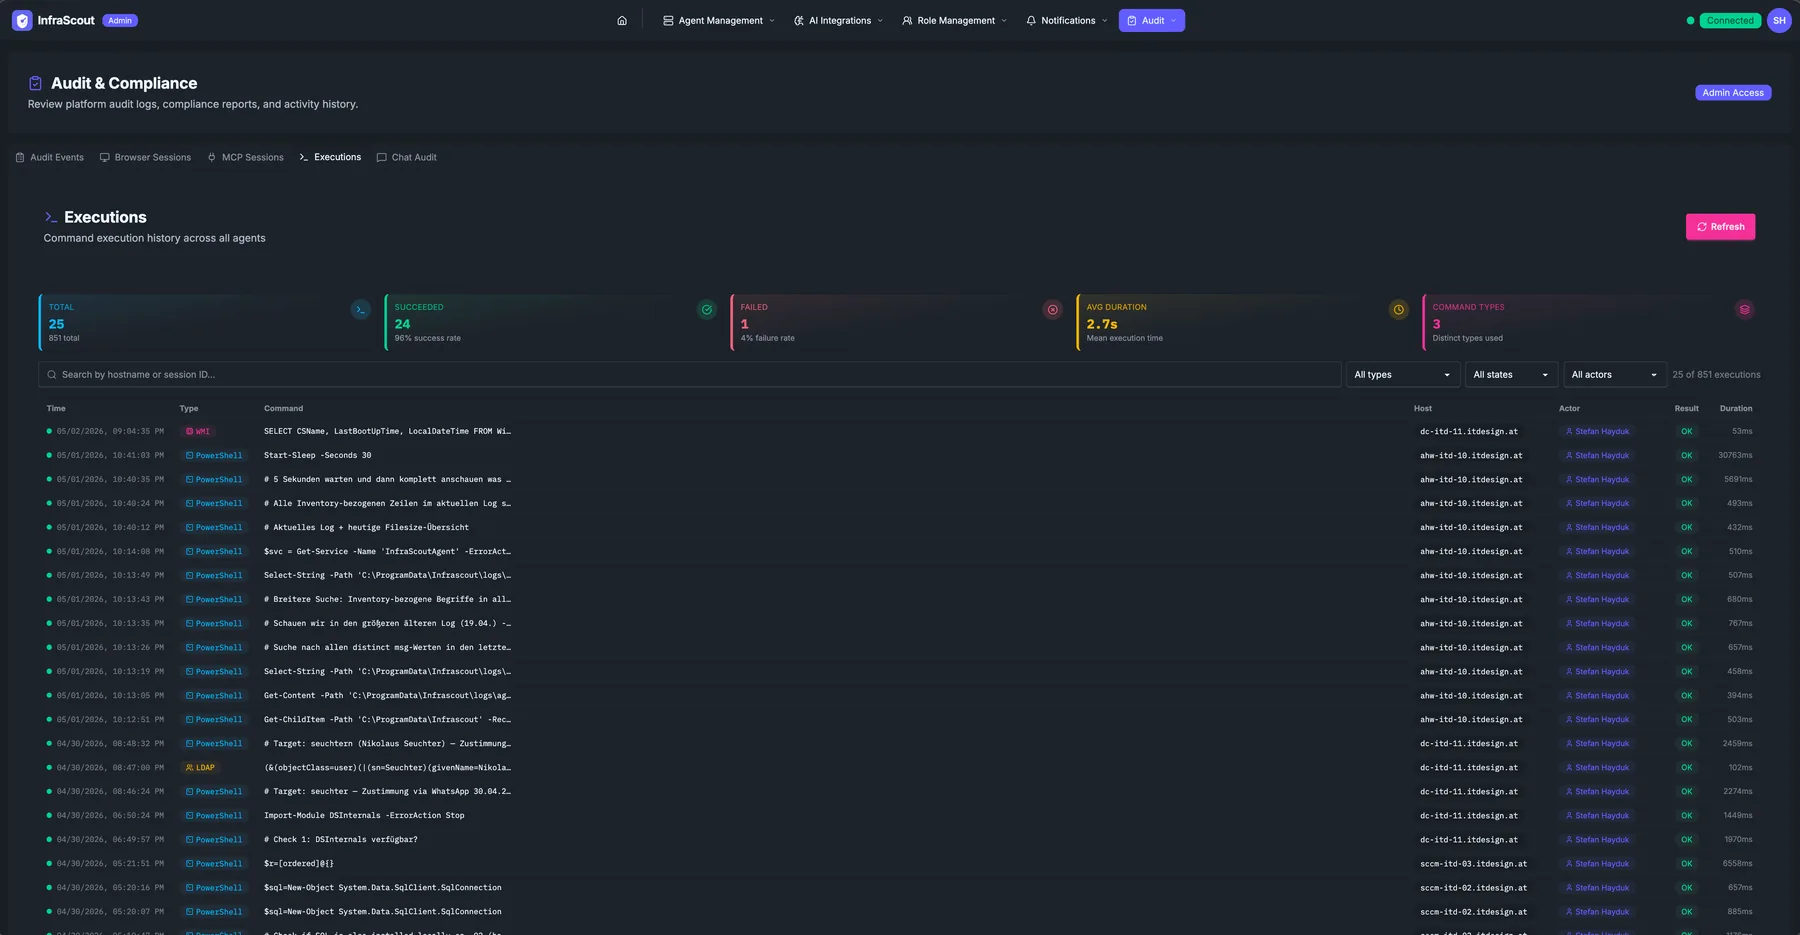
The split is enforced on the server, not just hidden in the interface. The personal endpoint will always scope results to the caller, regardless of what filters a client tries to send. So whatever surface you use — the web app, an MCP client, or a direct API call — the boundary holds.
Compass Why this matters
For everyday operators, the dashboard is now a single screen of "what should I be doing right now," with a clear path to "what's happening across the fleet" when you need it. For compliance officers and security leads, there's finally a dedicated audit-trail surface that doesn't compete for space with day-to-day operational signal. And for everyone, the personal Executions view gives you a clean record of your own actions without exposing your colleagues' work.
Try it out
Open the dashboard and start in My work — see the cards that map to your current assignments, then flip to All visible to compare. Admins can find the platform-wide audit list under Admin → Audit and Compliance → Executions.
If you're new to InfraScout, the Welcome page is the best place to start. Questions or feedback? Reach us at info@infrascout.cloud — we'd love to hear how the new layout fits your workflow.